

Observability for Modern Apps & Infrastructure
Stop finding out from your users
For developers and DevOps engineers who currently learn that production is broken from an angry user — and teams drowning in unstructured logs. You build the stack, break it, and run the on-call loop yourself.
The problem
Sound familiar?
You find out production is down from a user, a tweet, or a client call — never from your own tools.
You have terabytes of logs and still can’t answer “which requests were slow, and why?”
Your alerts either never fire or cry wolf so often everyone muted them — including the real one.
Leadership asks “what’s our uptime target and are we hitting it?” and you don’t have a number.
What you leave with
What you walk away with
Not notes — artifacts you built yourself, ready to use on Monday.
A working docker-compose observability stack on your laptop: app + Prometheus + Grafana + OpenTelemetry Collector + Jaeger
Your app emitting structured logs with request IDs, RED metrics on a dashboard you built, and one request traced end-to-end across services
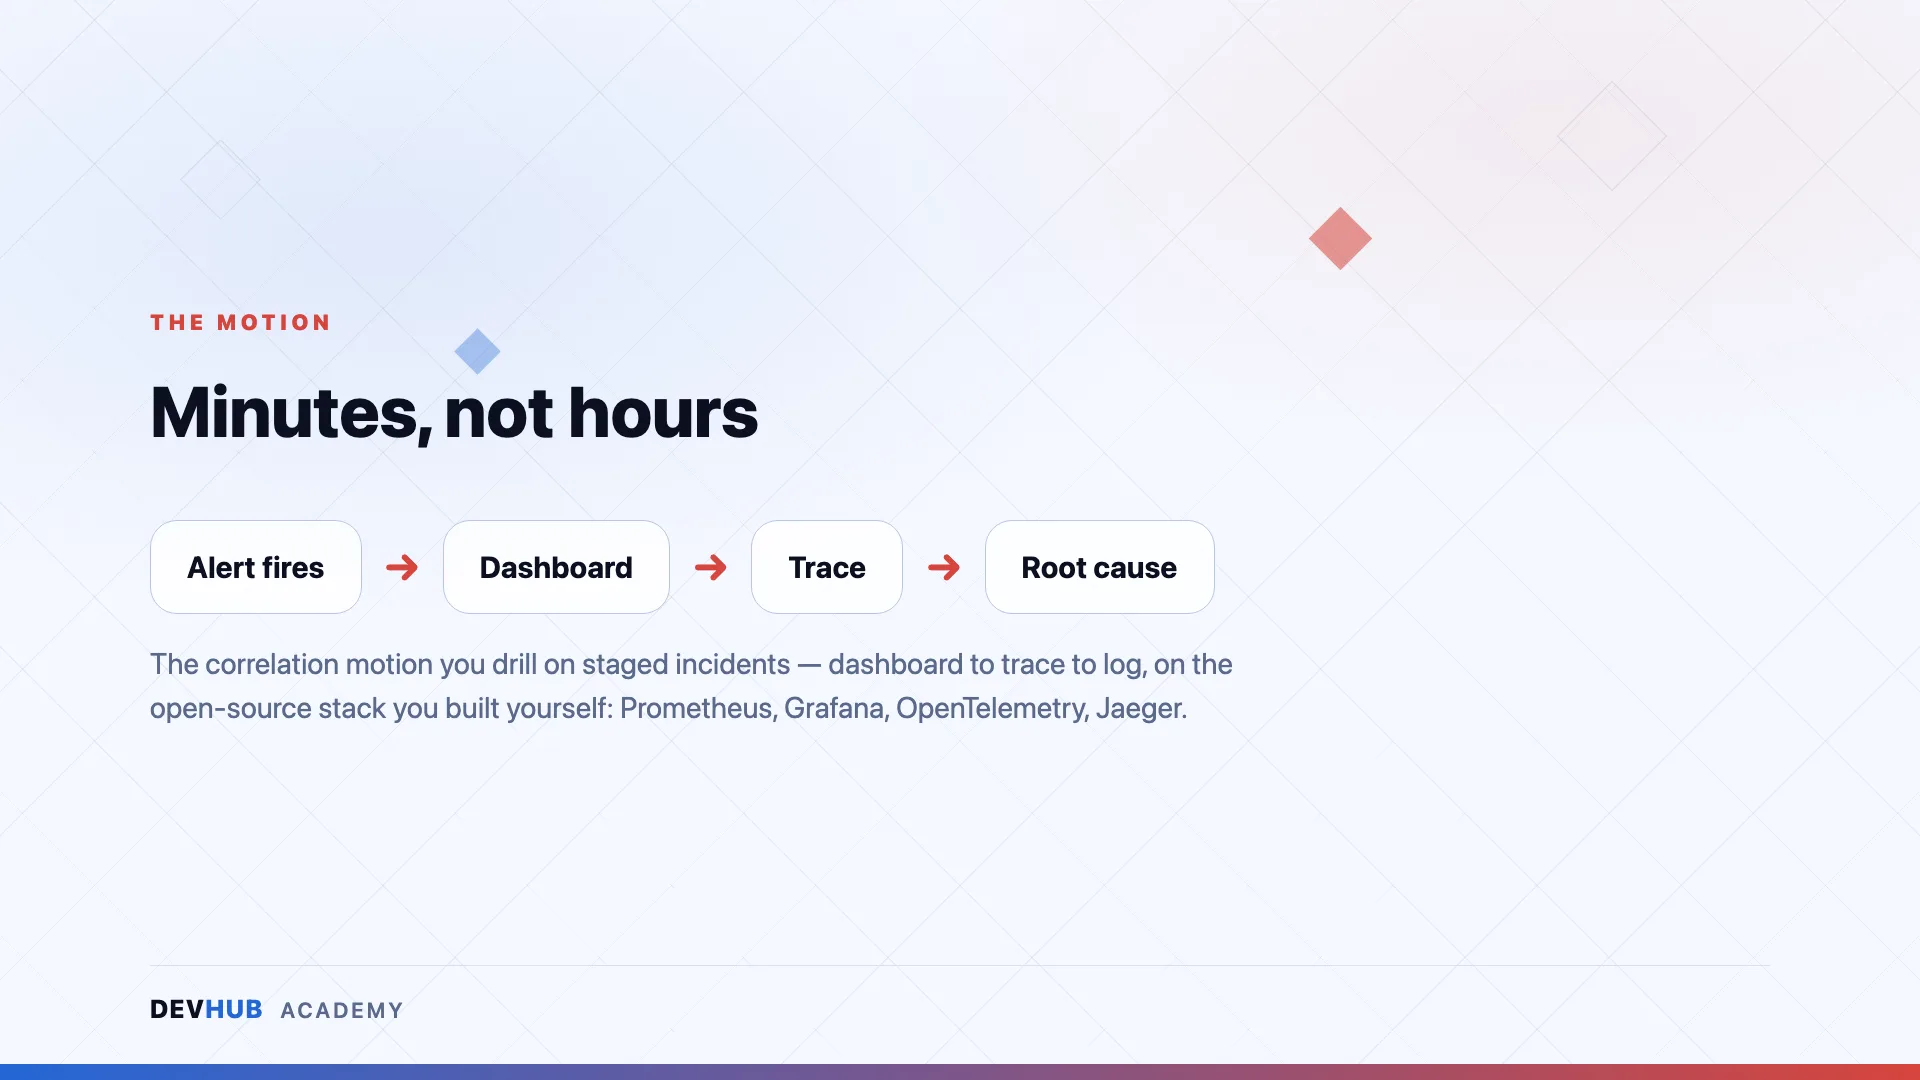
A staged incident debugged by correlating all three signals
An SLO with an error budget, and multi-window burn-rate alerts that fire on real problems and stay quiet on blips
A runbook in your own words, and a capstone incident closed under a time-box
The proof
Why this course delivers
3
signals: logs · metrics · traces
2+
staged incidents you debug
5
open-source tools, all take-home
Built on the industry-standard open-source stack every team can actually adopt — Prometheus, Grafana, OpenTelemetry, Jaeger
Every participant builds the whole stack themselves and survives two-plus staged incidents — the labs are the spine
Taught by the DevHub team behind Nadi, a production error-monitoring product — the same signals and on-call motion, operated for real
Questions
Frequently asked
Who is Observability for Modern Apps & Infrastructure for?
For developers and DevOps engineers who currently learn that production is broken from an angry user — and teams drowning in unstructured logs. You build the stack, break it, and run the on-call loop yourself.
What do I walk away with?
Artifacts you built yourself, not notes — including:
- A working docker-compose observability stack on your laptop: app + Prometheus + Grafana + OpenTelemetry Collector + Jaeger
- Your app emitting structured logs with request IDs, RED metrics on a dashboard you built, and one request traced end-to-end across services
- A staged incident debugged by correlating all three signals
Is this training hands-on or lecture-based?
Hands-on. Our trainings are taught by practitioners who ship production software daily — you spend the sessions building, breaking and fixing real things, not watching slides.
Is it delivered online or in person?
Delivery format and duration are decided per run — some runs are physical, some online. The details for each scheduled session are announced when registration opens.
How do I register, and how much does it cost?
Dates, venues and pricing are announced with each run. Hit “Get Notified” and you’ll be first in line when registration opens.
Ready to take a seat?
No run scheduled yet? Get notified and be first in line when registration opens — dates, venue and pricing land in your inbox first.